Chronic pain is a complex disease. When diagnosing and treating it, doctors need to be concerned about the basic characterizations of the pain experience, as well as multiple factors across biomedical, psychosocial, and biomechanical domains. These factors influence each other with complex, nested, and re-entrant relationships. For each patient, clinicians develop an individualized explanatory model of the pain, and therefore an individualized strategic plan for pain management.
This requires large amounts of data and requires substantial cognitive load for information processing. What CHOIR enables clinicians to do is to begin a basic multidisciplinary assessment of the patient before even meeting him or her. 53% of patients are completing the surveys at home, vs 47% in clinic. CHOIR then displays this information in a logical, easy-to-read format. Domains presented for clinician review include Education, Occupation, Adverse Childhood Experiences, and Substance History. As an example of a small portion of this computer-assisted documentation, on the left is the Social History of a simulated patient profile.
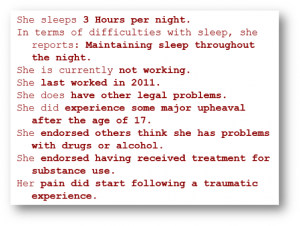
The dashboard also extracts relevant information in the patient’s self-reported history, and makes this easily viewable to the clinician on the CHOIR Provider Dashboard. On the left is an example of a simulated patient profile.
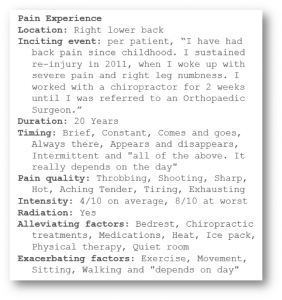
CHOIR generates outputs in clinicians’ language, organizing the information to provide a starting point for clinical documentation. Clinicians waste little time manually transferring information from paper questionnaires to electronic documentation. As an example, below we have captured the basic clinical characteristics of pain—the PQRST of a simulated patient profile.
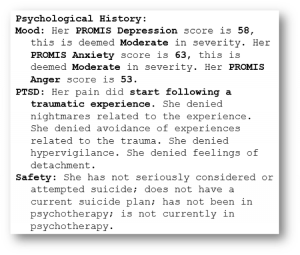
CHOIR also integrates PROMIS psychometric measures. In our experience, when these psychometric measures are displayed in a fuller, clinical context, they become more useful for the clinician. To further assist the clinician in interpreting the results, CHOIR provides severity interpretations from the PROsetta Stone project, such as “Severe Depression” or “Mild Anxiety”. On the left are examples from a simulated patient profile.
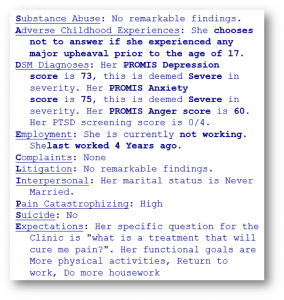
During the course of treating patients with chronic pain, providers alternately look at the pain condition from many perspectives. Each of these perspectives requires looking at different aspects of a patient’s biomedical, psychosocial, and biomechanical data. As an example, there are a number of factors that go into deciding whether a patient is a good candidate for any one interventional procedure. CHOIR displays the factors that have been found in the literature to be a predictor of outcome after procedures or surgeries. These include Substance Use, Adverse Childhood Experiences, Treatment expectations, and so on. CHOIR makes this information clear and easily available. Below is an example of a simulated patient profile.
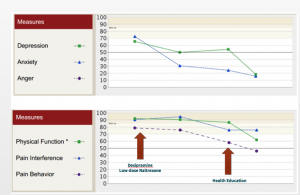
As patients continue with treatment, information is continuously collected. Questions that get answered include: What happens at subsequent visits? How have psychometric measures been affected as multiple treatments are stopped and started? Here is a fabricated example of follow-up data, with the associated PROMIS scores plotted. The Y-axis is the converted score in percentiles. The X-axis represents time.
At baseline, this patient demonstrated elevated Depression and Anxiety scores, and severely impaired Physical Function and Pain Interference. At the first visit, we initiated treatments. The patient then demonstrated substantial improvements in her PROMIS mood measures, which persisted for 2 follow-up assessments. However, the patient continued to demonstrate significantly impaired Physical Function and elevated Pain Interference. It was not until after the 3nd visit, when the Patient Educator sat down with the patient to focus on the patient’s functional activities, that the patient finally showed progressive improvements in Physical Function and Pain Interference. Here we see that by dynamically tracking individual psychometric measures, we can select treatments rationally and provide targeted and individualized treatment plans.
The Staff View
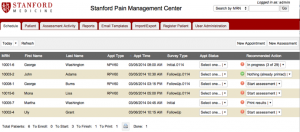
The Clinic staff has a dedicated Schedule View of all of the patients scheduled for the day, as well as a dashboard that updates live as the patients take surveys on mobile devices at the Clinic. A mock-up screen of a simulated schedule is below.
From day one, we actively involved staff for workflow optimization. In order to minimize staff and provider burden, extensive studies were performed to understand the impact on clinic workflow, and to design CHOIR in such a way as to minimize the impact. To date, there have been minimal complaints from staff or patients.
